Could Britain be heading towards an electrician shortage? New study weighs in
Elec Training study using ONS data finds Kensington and Chelsea has the fewest electricians per 10,000 homes, with London boroughs dominating the UK's longest-wait rankings.
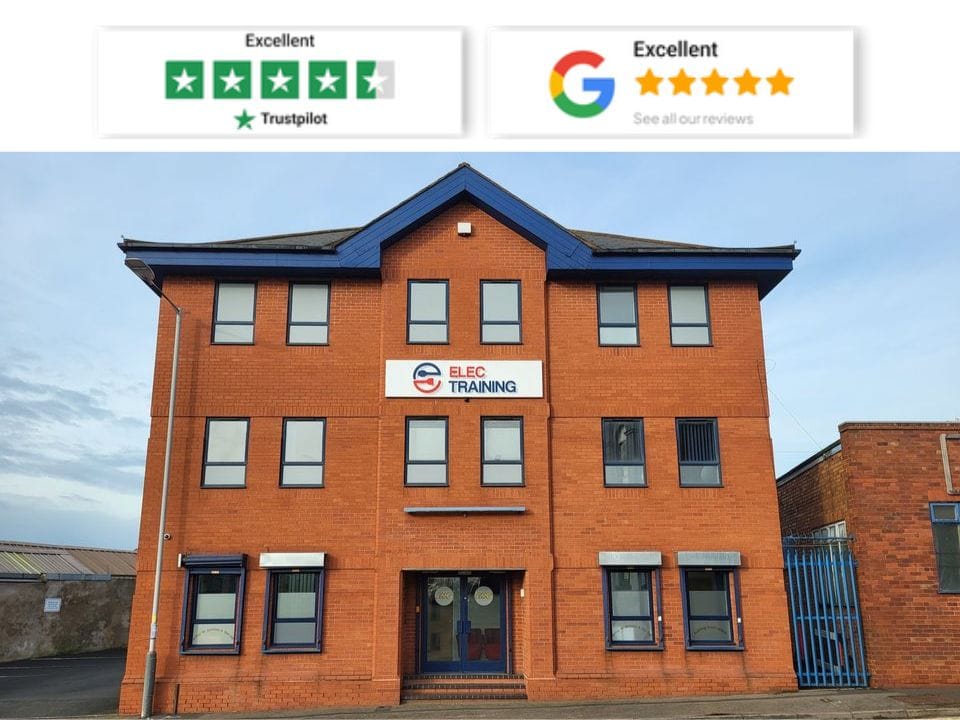
Need an electrician? These are the UK areas where you could face the longest wait, according to new research
A new study has revealed where it's hardest to get hold of an electrician in the UK, with Kensington and Chelsea leading the ranking.
According to the data, there are only 37.2 working electricians per 10,000 homes in Kensington and Chelsea, the lowest figure in the ranking.
London boroughs dominate the top 10 ranking, with Westminster, Camden, and Wandsworth all named as UK areas with exceptionally long waiting times for an electrician appointment.
In order to determine the ranking, the study examined data from the ONS Annual Population Survey to reveal which UK areas have the lowest number of working electricians per 10,000 homes.
A new study has revealed which UK areas have the longest wait times for an electrician. Research by the electrical training provider, Elec Training, examined data from the ONS Annual Population Survey to reveal which UK areas have the lowest number of working electricians per 10,000 homes. This allows for an accurate comparison between locations with different population sizes. The UK areas with the lowest number of working electricians per 10,000 homes were therefore identified as the areas where residents could potentially face the longest waits for an electrician due to the correlation between a low number of available electricians and long waiting times.
According to the data, Kensington and Chelsea is named as the UK area where it's hardest to get hold of an electrician. According to the study, there are only 37.2 working electricians per 10,000 homes in the area. This is nearly 75% below the national average of 147 electricians per 10,000 homes.
London boroughs continue to dominate the study's top 10 ranking, with Westminster identified as the UK area with the second-lowest number of working electricians. The study reveals that there are only 43.3 electricians per 10,000 homes in Westminster, which is nearly 71% below the national average.
Camden residents face the third-longest wait times for an electrician appointment in the UK. According to the research, there are only 49.7 electricians per 10,000 homes in Camden, which is 66% below the national average of 147 electricians per 10,000 homes.
Wandsworth has the fourth-lowest number of electricians in the UK, with only 63.4 electricians per 10,000 homes in the area. This suggests that Wandsworth has nearly 57% fewer electricians than the UK average.
The top 15 areas with the longest waiting times for an electrician appointment
| Rank | Area Name | Number of Electricians per 10,000 Homes | |---|---|---| | 1 | Kensington and Chelsea | 37.2 | | 2 | Westminster | 43.3 | | 3 | Camden | 49.7 | | 4 | Wandsworth | 63.4 | | 5 | Hammersmith and Fulham | 66.5 | | 6 | Richmond upon Thames | 68.9 | | 7 | Islington | 70.0 | | 8 | Tower Hamlets | 72.0 | | 9 | Southwark | 72.3 | | 10 | Hackney | 75.0 | | 11 | Manchester | 77.7 | | 12 | Lambeth | 83.7 | | 13 | Oxford | 84.9 | | 14 | Leicester | 90.6 | | 15 | Elmbridge | 91.7 |
Residents in Hammersmith and Fulham face the fifth-longest waiting times in the UK for an electrician appointment. The study reveals that there are only 66.5 electricians per 10,000 homes in Hammersmith and Fulham, which is nearly 55% below the UK national average.
Richmond upon Thames is identified as another UK area where it's hardest to get hold of an electrician. According to the research, there are 68.9 electricians per 10,000 homes in Richmond upon Thames, which is over 53% below the national average of 147 electricians per 10,000 homes.
Islington has the seventh-lowest number of electricians in the UK, according to the research. There are only 70 working electricians per 10,000 homes in the area. This suggests that Islington has 52% fewer electricians than the UK average.
Tower Hamlets has the eighth-lowest number of working electricians in the UK, with 72 electricians per 10,000 homes. This is 51% below the UK national average of 147 electricians per 10,000 homes.
Residents living in Southwark face the ninth-longest waiting times for an electrician appointment in the UK. The study reveals that there are 72.3 electricians per 10,000 homes in Southwark, which is nearly 51% below the national average.
Hackney residents have the tenth-longest waiting times for an electrician appointment in the UK, with only 75 working electricians per 10,000 homes in the area. This suggests that Hackney has nearly 49% fewer electricians than the UK average.
Manchester is identified as another UK area where residents face some of the longest waiting times for an electrician appointment. The study reveals that there are 77.7 working electricians per 10,000 homes in Manchester, which is over 47% below the UK average of 147 electricians per 10,000 homes.
Lambeth is also named among the UK areas where it's hardest for residents to get hold of an electrician, with only 83.7 electricians per 10,000 homes in the area.
Oxford residents also face exceptionally long waiting times for an electrician appointment, with only 84.9 electricians per 10,000 homes in the city. This suggests that Oxford has 42% fewer working electricians than the UK average.
Other areas with long waiting times include Leicester, with 90.6 electricians per 10,000 homes, and Elmbridge, which has 91.7 electricians per 10,000 homes.
Meanwhile, the study also highlights the UK areas where it's easiest to obtain an electrician appointment. According to the study, Havering is identified as the UK area with the highest number of electricians per 10,000 homes. The London borough has 260.9 electricians per 10,000 homes in the area, which is over 77% higher than the national average of 147 electricians per 10,000 homes.
Broxbourne has the second-largest number of working electricians in the study, with 258 working electricians per 10,000 homes. This highlights that Broxbourne has over 75% more electricians than the UK average.
Residents in Dartford could face the third-shortest waiting times for an electrician appointment in the UK, with 246.6 electricians per 10,000 homes.
Other UK areas where it's easiest for residents to book an electrician appointment include Gravesham, Stevenage, Thurrock, Medway, and Bexley.
The top 10 areas with the shortest waiting times for an electrician appointment
| Rank | Area Name | Number of Electricians per 10,000 Homes | |---|---|---| | 1 | Havering | 260.9 | | 2 | Broxbourne | 258.0 | | 3 | Dartford | 246.6 | | 4 | Bexley | 246.4 | | 5 | Medway | 239.6 | | 6 | Thurrock | 236.7 | | 7 | Stevenage | 234.2 | | 8 | Gravesham | 233.9 | | 9 | Harlow | 222.9 | | 10 | Castle Point | 220.4 |
Charanjit Mannu, the Director of Elec Training, commented on the study: "This research highlights that there is a clear disparity between the number of electricians across the UK.
"Interestingly, London boroughs dominate the study's ranking of the UK areas with the fewest number of electricians. This suggests that Greater London is facing a real electrician shortage, with companies potentially struggling to meet demand from London's large population.
"As the data only accounts for where electricians live, not where they work, this could also explain why London boroughs dominate the study's ranking.
"Due to London's high cost of living, it's likely that electricians are commuting in from nearby areas rather than living in these London boroughs, which explains the electrician shortages in these areas.
"Consequently, this could also increase waiting times in these London boroughs due to the necessity for nearby electricians to commute in from elsewhere.
"According to data from the Department for Education, there were 3,810 newly qualified electricians in England in 2024/25, which is a slight decline from the previous year's figure of 3,900 newly qualified electricians in 2023/24.
"A recent report from JLT Training also highlights that the electrical workforce in England is now 25% smaller than it was in 2018, with more people predicted to leave the workforce than enter it.
"Four years from now, people may begin to notice that it's even harder to get an electrician out to a job if this trend continues.
"This suggests that the UK faces a very real risk of an electrician shortage in the coming years, which will create even longer waiting times for an electrician appointment."
This information was provided by the electrical training provider, Elec Training.
Methodology
- The research examined data from the ONS Annual Population Survey to reveal the number of electricians per 10,000 homes in each UK town and city.
- The UK areas with the lowest number of electricians per 10,000 homes were considered to have the longest waiting times for an electrician appointment.
- Only UK regions with 20,000 or more households were included in the study.
Sources
ONS Annual Population Survey: https://www.ons.gov.uk/employmentandlabourmarket/peopleinwork/employmentandemployeetypes/methodologies/annualpopulationsurveyapsqmi
JLT Training Report: https://jtltraining.com/news/uk-falling-thousands-short-of-electricians-from-workforce-as-numbers-stand-still/
Department for Education: https://explore-education-statistics.service.gov.uk/find-statistics/apprenticeships/2024-25
The top 100 UK areas with the longest waiting times for an electrician appointment
| Rank | Area Name | Number of Electricians per 10,000 Homes | |---|---|---| | 1 | Kensington and Chelsea | 37.2 | | 2 | Westminster | 43.3 | | 3 | Camden | 49.7 | | 4 | Wandsworth | 63.4 | | 5 | Hammersmith and Fulham | 66.5 | | 6 | Richmond upon Thames | 68.9 | | 7 | Islington | 70.0 | | 8 | Tower Hamlets | 72.0 | | 9 | Southwark | 72.3 | | 10 | Hackney | 75.0 | | 11 | Manchester | 77.7 | | 12 | Lambeth | 83.7 | | 13 | Oxford | 84.9 | | 14 | Leicester | 90.6 | | 15 | Elmbridge | 91.7 | | 16 | Norwich | 92.3 | | 17 | Cotswold | 92.6 | | 18 | Cambridge | 93.4 | | 19 | Chichester | 97.4 | | 20 | Derbyshire Dales | 98.8 | | 21 | Newcastle upon Tyne | 99.6 | | 22 | Winchester | 100.0 | | 23 | Stratford-on-Avon | 100.4 | | 24 | Haringey | 100.9 | | 25 | Isle of Wight | 101.6 | | 26 | Lewisham | 102.0 | | 27 | Ryedale | 102.8 | | 28 | Brighton and Hove | 104.0 | | 29 | Waverley | 104.3 | | 30 | North Norfolk | 105.0 | | 31 | South Hams | 106.8 | | 32 | Nottingham | 106.9 | | 33 | Warwick | 108.6 | | 34 | Liverpool | 109.7 | | 35 | Derby | 110.6 | | 36 | Harrogate | 110.7 | | 37 | Pendle | 111.1 | | 38 | Birmingham | 111.7 | | 39 | Monmouthshire | 111.9 | | 40 | Fylde | 112.0 | | 41 | Craven | 112.0 | | 42 | Tunbridge Wells | 112.6 | | 43 | Vale of Glamorgan | 112.6 | | 44 | Conwy | 113.1 | | 45 | Hambleton | 113.2 | | 46 | Cheltenham | 113.8 | | 47 | Cardiff | 114.2 | | 48 | Ceredigion | 114.3 | | 49 | County Durham | 114.8 | | 50 | Northumberland | 115.0 | | 51 | Trafford | 115.6 | | 52 | Rother | 117.3 | | 53 | Scarborough | 117.4 | | 54 | Cheshire East | 117.8 | | 55 | Eden | 117.8 | | 56 | St Albans | 118.0 | | 57 | Eastbourne | 118.2 | | 58 | York | 118.3 | | 59 | Kingston upon Thames | 118.7 | | 60 | East Lindsey | 118.8 | | 61 | West Devon | 119.3 | | 62 | Richmondshire | 120.3 | | 63 | Gateshead | 120.5 | | 64 | Cheshire West and Chester | 120.6 | | 65 | Pembrokeshire | 120.9 | | 66 | Barnet | 121.2 | | 67 | Bath and North East Somerset | 121.8 | | 68 | Exeter | 121.8 | | 69 | Rushcliffe | 121.9 | | 70 | Salford | 122.0 | | 71 | Lincoln | 122.3 | | 72 | Malvern Hills | 122.4 | | 73 | Coventry | 122.4 | | 74 | North Tyneside | 122.5 | | 75 | Guildford | 123.4 | | 76 | East Devon | 123.8 | | 77 | Sandwell | 123.8 | | 78 | Thanet | 124.6 | | 79 | Wychavon | 124.7 | | 80 | Blackburn with Darwen | 125.1 | | 81 | Wirral | 125.4 | | 82 | Blackpool | 125.6 | | 83 | Windsor and Maidenhead | 125.7 | | 84 | Bradford | 125.8 | | 85 | Great Yarmouth | 126.4 | | 86 | Wolverhampton | 126.4 | | 87 | Sunderland | 126.5 | | 88 | South Oxfordshire | 126.5 | | 89 | Preston | 127.2 | | 90 | South Cambridgeshire | 127.3 | | 91 | Dorset | 127.4 | | 92 | Sheffield | 128.0 | | 93 | Darlington | 128.4 | | 94 | Stockport | 128.5 | | 95 | Hounslow | 128.5 | | 96 | Ribble Valley | 128.6 | | 97 | Torbay | 129.2 | | 98 | Canterbury | 129.6 | | 99 | Southend-on-Sea | 129.8 | | 100 | Isle of Anglesey | 130.8 |
Notes to editors
- Organisation
- Elec Training
- Contact
- Freya Keeping
- Website
- https://elec.training
Contact details are hidden from automated harvesters. Click to show them.